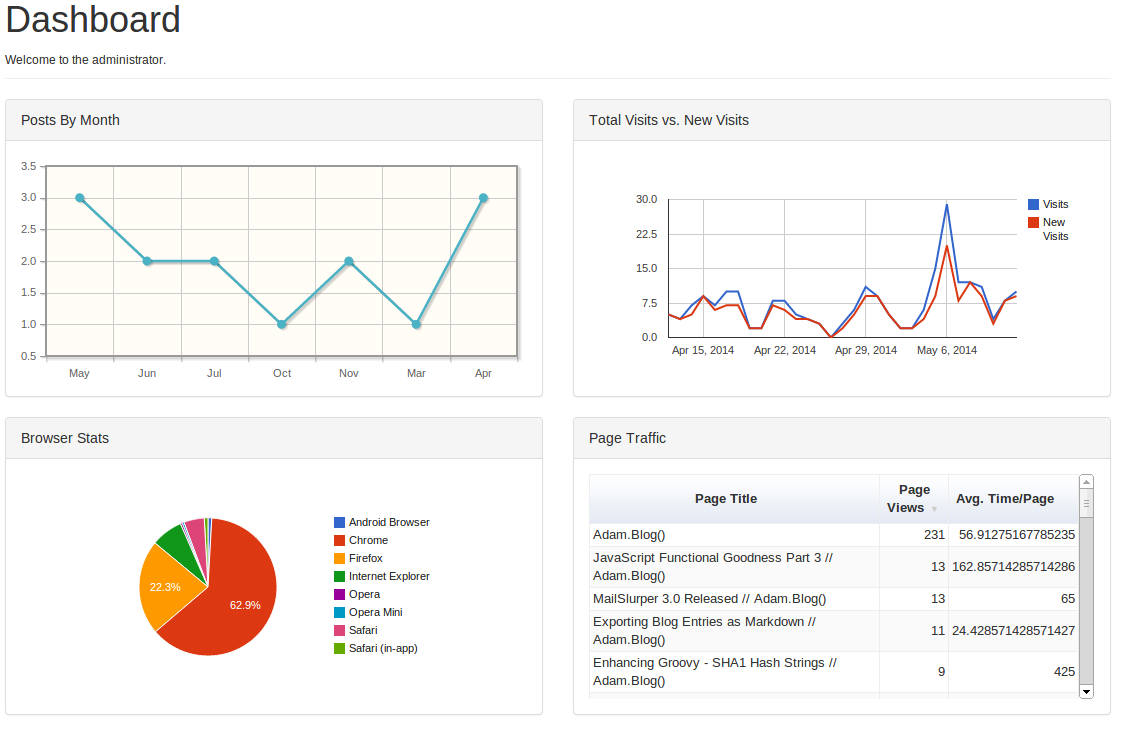
Tonight I have integrated a few reports from Google Analytics into the Texo adminstrator Dashboard. I have included a Visits vs New Visits, Browser Stats, and Page Traffic information. Now I don’t have to log in to the Google Analytics dashboard unless I really want to dig into stats. Most often I just want to see page views and what posts are getting the most hits.
To put these graphs on my dashboard I opted to use a 3rd party library called OOCharts. Their service hooks up to your Google account and provides a simplified API for retrieving charts and chart data. For example the code the retrieve the Browser usage pie chart looks like this.
oo.setAPIKey("MyAPIKey");
oo.load(function() {
    var
       browsers = new oo.Pie("MyProfileId", "30d");

    browsers.setMetric("ga:visits", "Visits");
    browsers.setDimension("ga:browser");

    browsers.draw("browserChart");
});
When you include the oocharts.js file on your page, or inject it using RequireJS in my case, you get a global variable called oo to use for interacting with the OOCharts API. The first activity you must perform is to initialize the library with your API key. An API key is retrieved from the OOCharts site when you sign up and link to your Google account. After this you need to call the load() function and provide it a callback function in which you can do all your chart initialization.
In our callback function we are setting up a new pie chart by initializing the constructor to the Pie object, passing in a profile ID and the duration of time in which to report on. In this example we are getting 30 days worth of data. Profile ID is another piece of data retrieved from either the OOCharts site or the Google Analytics dashboard. Next I am telling the Pie instance that I want to get visitor data (ga:visits) and report against browser usage (ga:browser). The final step is to call the draw() method passing in the ID of the div that will contain my chart.
OOCharts is a quick way to get started getting Google Analytics in your web application. I am impressed with how easy it was to get started. And now my dashboard has pretty charts! Yay, and happy coding!